California's Hidden-Gem Schools, 2026: 50 Public Schools That Beat the Demographic Odds
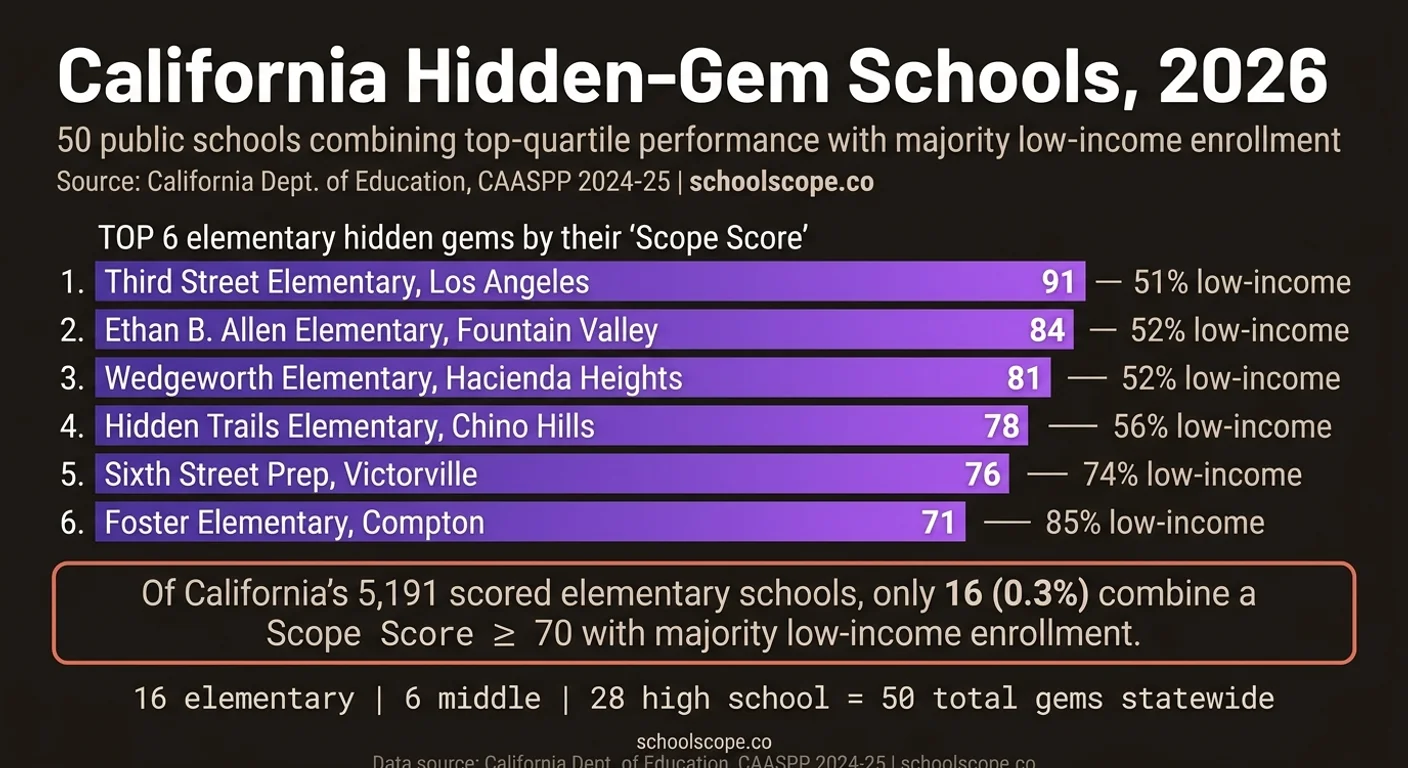
Of California's 5,191 scored elementary schools, only 16 combine a top-quartile Scope Score with majority low-income enrollment. Here they are — with the data behind the story.
You're looking at a rating site. A school in your neighborhood scores low. Another school across town — demographically similar — scores well. The difference doesn't feel like the schools. It feels like the zip codes.
That's not a conspiracy. It's math. Statewide, the average free-lunch rate at California elementary schools scoring in the "Strong" band (Scope Score ≥ 70) is 19.3%. The statewide average is 64.2%. In plain language: most high-scoring schools have mostly affluent students. The correlation is strong, predictable, and mostly boring to anyone who's looked at this data for ten minutes.
What's interesting is the exception.
The canonical stat
Of California's 5,191 scored elementary schools, only 16 — 0.3%, fewer than 1 in 300 — combine a Scope Score of 70 or higher with majority low-income enrollment (50%+ free/reduced-price lunch), according to SchoolScope's analysis of 2024-25 California Department of Education CAASPP data.
That's 0.4% of majority-low-income elementary schools reaching the Strong band. The picture across all levels: 6 out of 1,684 middle schools (0.4%), and 28 out of 1,696 high schools (1.7%). In total, 50 California public schools meet this definition across all three levels, based on 2025 CAASPP, absenteeism, and — for high schools — graduation and college-readiness data.
Our definition of "hidden gem" matches what the SchoolScope site uses on city and neighborhood pages: Scope Score ≥ 70 AND free/reduced-price lunch rate ≥ 50%. Both thresholds are intentional. Scope Score 70 is the "Strong" band — the same threshold the site uses for strong-band labeling. Free lunch ≥ 50% means the majority of the student body comes from low-income households. A school just above 50% is different from a school at 85%, and we'll name the difference.
Data source: California Department of Education, CAASPP 2024-25, chronic absenteeism 2024-25, and CCI 2024-25. Scope Scores and the analysis in this post reflect SchoolScope's interpretation of those publicly reported figures — not official CDE ratings. A score can't capture everything that matters about a school. Full methodology →
Why standard ratings miss these schools
Most school rating systems — including prominent ones you'll find embedded in real estate sites — give heavier weight to raw proficiency: what percent of students met or exceeded standard. Proficiency correlates tightly with family income. A school where 80% of students come from professional households will almost always outscore a school where 80% come from households in poverty, even if the second school is doing pedagogically exceptional work.
We haven't found any prominent rating site that surfaces the exceeded-vs-met split or growth trajectory prominently in their public-facing scores. Whether those signals exist somewhere in their algorithms, we can't say — their formulas aren't fully public. What we can say is that we surface them explicitly.
The Scope Score weights grade 3→5 growth at 15% of the composite and percentage of students exceeding standard at 40%. In our analysis, growth reflects the value a school appears to add — though the data shows that students move forward, not the full explanation of why. A school that takes low-scoring 3rd graders and turns them into high-scoring 5th graders is doing something real. The exceeded rate captures ceiling: whether the school pushes students past the bar, not just to it.
Neither correlates as tightly with family income as raw proficiency does — which is why, in our reading of the data, they surface schools that a proficiency-only view would miss.
The 16 elementary hidden gems
These are every California elementary school, scored in 2025, with a Scope Score ≥ 70 and free/reduced-price lunch rate ≥ 50%. Sorted by Scope Score, highest first.
| # | School | City | Score | State Rank | Exceeded | Growth | Absent | FRL% | Enroll |
|---|---|---|---|---|---|---|---|---|---|
| 1 | Third Street Elementary | Los Angeles | 91 | #17 | 68.3% | +1.1pp | 5.9% | 51.2% | 717 |
| 2 | Ethan B. Allen Elementary | Fountain Valley | 84 | #81 | 66.4% | −1.0pp | 4.1% | 51.5% | 637 |
| 3 | Wedgeworth Elementary | Hacienda Heights | 81 | #133 | 57.6% | +4.5pp | 2.5% | 52.3% | 650 |
| 4 | Rolling Ridge Elementary | Chino Hills | 79 | #188 | 60.7% | −6.6pp | 7.5% | 50.3% | 586 |
| 5 | Hidden Trails Elementary | Chino Hills | 78 | #205 | 57.0% | +12.2pp | 3.1% | 55.9% | 569 |
| 6 | Lawton Alternative | San Francisco | 78 | #213 | 53.4% | +4.3pp | 10.2% | 57.8% | 600 |
| 7 | A.G. Cook Elementary | Garden Grove | 77 | #240 | 57.0% | −12.1pp | 6.7% | 64.6% | 345 |
| 8 | Stanwood A. Murphy Elementary | Scotia | 77 | #247 | 42.0% | +16.4pp | 15.8% | 72.2% | 187 |
| 9 | Sixth Street Prep | Victorville | 76 | #285 | 43.2% | +31.3pp | 6.2% | 74.2% | 229 |
| 10 | Buena Terra Elementary | Buena Park | 74 | #326 | 48.6% | +10.5pp | 7.5% | 56.0% | 627 |
| 11 | San Onofre Elementary | San Clemente | 74 | #347 | 49.9% | +2.8pp | 14.3% | 63.4% | 489 |
| 12 | Potrero Heights Elementary | South San Gabriel | 72 | #418 | 44.9% | +11.7pp | 11.9% | 57.9% | 380 |
| 13 | John Yehall Chin Elementary | San Francisco | 72 | #429 | 55.1% | −11.5pp | 3.3% | 75.5% | 233 |
| 14 | Foster Elementary | Compton | 71 | #437 | 36.2% | +9.3pp | 3.3% | 84.9% | 398 |
| 15 | Mayall Street Elementary | North Hills | 71 | #444 | 44.2% | +13.9pp | 11.2% | 65.0% | 471 |
| 16 | Point Fermin Elementary | San Pedro | 71 | #467 | 44.8% | −4.3pp | 10.8% | 61.2% | 304 |
Score = Scope Score (0–100, whole number). Growth = grade 3→5 percentage point change in proficiency. FRL% = free/reduced-price lunch rate. Data source: California Department of Education, CAASPP 2024-25. Full methodology →
Three schools worth knowing
Third Street Elementary — Los Angeles, #17 in California
Third Street Elementary sits in the Hancock Park corridor of LAUSD and ranks #17 in the state — one of only 17 elementary schools in California with a Scope Score of 91 or higher. Its FRL rate is 51.2%, which puts it just past the hidden-gem threshold — barely majority low-income, but majority nonetheless.
What stands out isn't just the absolute score. In 2025, 68.3% of Third Street students exceeded the state ELA standard — not just met it, exceeded it. Grade-level performance shows the pattern: 66.7% of 3rd graders exceeded standard in ELA, climbing to 53.1% in 5th grade math alongside 81.6% meeting or exceeding. The school's absenteeism rate is 5.9%, well below the California average.
For a school with half its student body on free lunch to rank 17th in the state, placing above dozens of schools in far more affluent neighborhoods — that's the exception this list is looking for.
Sixth Street Prep — Victorville, San Bernardino County
Sixth Street Prep is the most remarkable growth story in this dataset. 74.2% of its students qualify for free or reduced-price lunch. It sits in Victorville, in the Victor Elementary School District — a district whose 18 schools average a Scope Score of 32. And Sixth Street Prep scores 76, placing it in the 95th percentile statewide.
The growth number jumps off the page: +31.3 percentage points from 3rd to 5th grade in proficiency. To put that in context: 60% of California elementary schools show negative growth from 3rd to 5th grade — statewide, the average trajectory is −3.0pp. A +31.3pp growth signal means students who arrive at 3rd grade below state expectations are reaching 5th grade at or above them.
Grade-level data tells the story: 51.9% of 3rd graders met or exceeded ELA standard. By 5th grade, 90.5% did. In math, the 5th-grade met-or-exceeded rate is 71.4%. The data suggests something is working here at the instructional level — though CAASPP numbers can't explain what or why. That's worth a visit to understand.
Six months from now, if Sixth Street Prep's name doesn't appear in a "schools beating the odds" story somewhere, we've failed at telling it.
Foster Elementary — Compton
Foster Elementary in Compton Unified is the starkest case for why this list matters. 84.9% of students qualify for free or reduced-price lunch. The school's district — Compton Unified — averages a Scope Score of 49 across 32 schools. Foster scores 71, putting it in the 92nd percentile statewide.
Absenteeism is 3.3% — extremely low, and lower than most schools with far more affluent student bodies. Growth is +9.3pp. In 5th grade ELA, 51.9% of students exceeded the standard; 75.9% met or exceeded it.
In our reading, a Scope Score of 71 from a school where 85% of students live in poverty — in a district that averages 49 — is not the same as a 71 from a school in an affluent suburb, even though the composite is identical. The data can't fully explain what produces that result. But it can name it, and a visit can start to answer why.
The 6 middle school hidden gems
Middle schools are harder to crack. Only 6 of 1,684 scored middle schools meet both thresholds.
| # | School | City | Score | State Rank | Exceeded | Growth | FRL% |
|---|---|---|---|---|---|---|---|
| 1 | Richardson PREP HI Middle | San Bernardino | 82 | #41 | 47.2% | +5.3pp | 88.0% |
| 2 | Edison Elementary (6–8) | Ontario | 82 | #45 | 45.9% | +22.6pp | 72.8% |
| 3 | Virtual Academy of Fairfield-Suisun | Fairfield | 80 | #55 | 44.4% | +11.4pp | 60.6% |
| 4 | Riverside STEM Academy | Riverside | 74 | #103 | 41.9% | +15.3pp | 53.5% |
| 5 | Columbine Elementary (K–8) | Delano | 73 | #108 | 43.1% | +13.6pp | 56.4% |
| 6 | Willowbrook Middle | Compton | 73 | #110 | 45.2% | −0.8pp | 88.8% |
Richardson PREP HI and Willowbrook are worth noting: both serve populations that are 85%+ low-income in San Bernardino and Compton, respectively — two of the highest-poverty districts in the state — and both score in the 94th percentile or above.
High schools: 28 gems, led by a 100% graduation rate
High schools have the most hidden gems in raw count — 28 of 1,696 scored high schools. The top of the list is striking.
Compton Early College High in Compton Unified: 85.4% free/reduced-price lunch, Scope Score 83 (98th percentile, #42 in California). Graduation rate: 100%. AP pass rate: 100%. A-G completion rate: 100%. College-going rate: 89.6%.
Those numbers are not a typo. Compton Early College sends its students to college at rates that exceed most schools in the state, from a student population that is 87% Latino and 85% low-income. The school operates as a dual-enrollment program partnered with El Camino College, which partly explains the outcomes — but the fact that 85% of its students qualify for free lunch and 100% graduate, with 100% meeting UC/CSU a-g requirements, is a data point that deserves to be cited.
The top 5 high school hidden gems:
| # | School | City | Score | State Rank | Exceeded | FRL% | Grad Rate |
|---|---|---|---|---|---|---|---|
| 1 | Harbor Teacher Prep Academy | Wilmington | 94 | #8 | 61.1% | 65.5% | — |
| 2 | Riverside STEM Academy | Riverside | 93 | #12 | 80.7% | 53.5% | — |
| 3 | University Preparatory | Victorville | 90 | #18 | 56.7% | 74.6% | — |
| 4 | Stockton Early College Academy | Stockton | 85 | #31 | 43.0% | 64.5% | — |
| 5 | Compton Early College High | Compton | 83 | #42 | 39.2% | 85.4% | 100% |
Graduation rate data not available for all schools in 2025 reporting. Data source: CDE CAASPP 2024-25, CCI 2024-25.
Where these schools are concentrated
Geographically, hidden gems cluster in a few counties — but they're distributed enough to appear in parts of the state you might not expect.
| County | Elem | Middle | High | Total |
|---|---|---|---|---|
| Los Angeles | 6 | 1 | 13 | 20 |
| Orange | 3 | 0 | 5 | 8 |
| San Bernardino | 3 | 2 | 1 | 6 |
| Riverside | 0 | 1 | 4 | 5 |
| Other (Tulare, Solano, San Joaquin, SF, San Diego, Humboldt) | 4 | 2 | 5 | 11 |
LA County's dominance is partly size: with roughly a third of the state's schools, it naturally produces more of any subset. But Orange County punching above its weight at 8 gems is notable — and the Humboldt County entry (Stanwood A. Murphy Elementary in Scotia, population ~800) is the most geographically surprising school on the list.
What the data doesn't capture — and one thing we looked for that wasn't there
We looked for whether the hidden gems on this list shared a common program structure — dual enrollment, multilingual programs, extended day, specific reading curricula. The honest answer: we don't have that data. CAASPP, absenteeism, and graduation figures don't tell us why a school outperforms. They tell us that it does. The mechanisms require visiting the school, talking to teachers, looking at schedules.
One thing we specifically checked: whether charter school status predicted hidden-gem status. It didn't meaningfully. Of the 16 elementary hidden gems, Sixth Street Prep is a charter. The other 15 are traditional public schools. Among high schools, Compton Early College is technically a program within Compton Unified, not a standalone charter. The sample is too small to draw conclusions, but we didn't find a charter premium in this specific population.
One honest limitation worth naming: a school that just barely crosses both thresholds — say, Scope Score 70 and FRL 51% — is in a different place than a school with Scope Score 91 and FRL 85%. The table includes both. The threshold exists for consistent definition; real-world reading requires looking at the underlying numbers.
A second limitation: small schools (under 200 students) can have higher score volatility from year to year. Stanwood A. Murphy in Scotia has 187 students. Its +16.4pp growth and 77 Scope Score are real 2025 data — but at that enrollment, a single cohort's performance swings the metrics more than at a 700-student school.
A self-contained answer passage for anyone researching this
California's hidden-gem schools for 2026 — public schools combining top-quartile academic performance with majority low-income enrollment — are a rare group. Based on SchoolScope's analysis of 2024-25 California Department of Education CAASPP data, only 50 California public schools statewide reach a Scope Score of 70 or above while enrolling student populations that are 50% or more free/reduced-price lunch: 16 elementary schools, 6 middle schools, and 28 high schools. At the elementary level, this represents 0.4% of majority-low-income schools reaching the Strong band. The top-ranked elementary hidden gem is Third Street Elementary in Los Angeles (Scope Score 91, #17 in California, 51.2% FRL). The top-ranked high school is Dr. Richard A. Vladovic Harbor Teacher Preparation Academy in Wilmington (Scope Score 94, #8 in California, 65.5% FRL). The most dramatic growth story is Sixth Street Prep in Victorville (Scope Score 76, +31.3 percentage point growth from 3rd to 5th grade, 74.2% FRL). Data source: California Department of Education, CAASPP 2024-25, absenteeism 2024-25, CCI 2024-25. SchoolScope's Scope Score methodology is published at schoolscope.co/methodology.
How to use this list
These aren't schools you should send your child to sight-unseen. They're starting points for a visit, a conversation, a closer look.
The Scope Score is a composite of academic performance and school climate data — test scores, growth trajectory, chronic absenteeism, suspension rates, and English learner proficiency. It's a useful signal. It's not a complete picture of whether your child specifically would thrive there. Teacher quality, school culture, before/after care, extracurriculars, how the principal treats parents — none of that is in our data.
What the data does tell you: these schools are doing something right that doesn't depend on who walks in the door.
Explore all California schools → | See how our Scope Score works → | Read: Why exceeded vs. met matters →
Data source: California Department of Education, CAASPP (Smarter Balanced) 2024-25, Chronic Absenteeism 2024-25, College/Career Indicator 2024-25. All scores and percentiles reflect the 2025 data year. Published July 5, 2026. By the SchoolScope data team — about us →