Put your child’s number into the staircase to see the level, the distance to each neighboring line, and where the score falls among California children who tested. Then read the report alongside recent classwork before you talk with the teacher. If you are waiting for the report, see when 2026 scores come out.
What scale score falls in each level?
The number behind the word is the scale score, and its ranges change with every grade.
A scale score is the state’s estimate of what your child showed on the test. For English and math, it’s a four-digit number in the 2000s. Each level starts at a cutoff, the lowest score that counts for that level. The cutoffs climb every grade. The same number means something different in grade 4 than in grade 6.
What does your child’s score mean?
How far a score sits from the lines between the four levels. Your child’s report doesn’t print those lines.
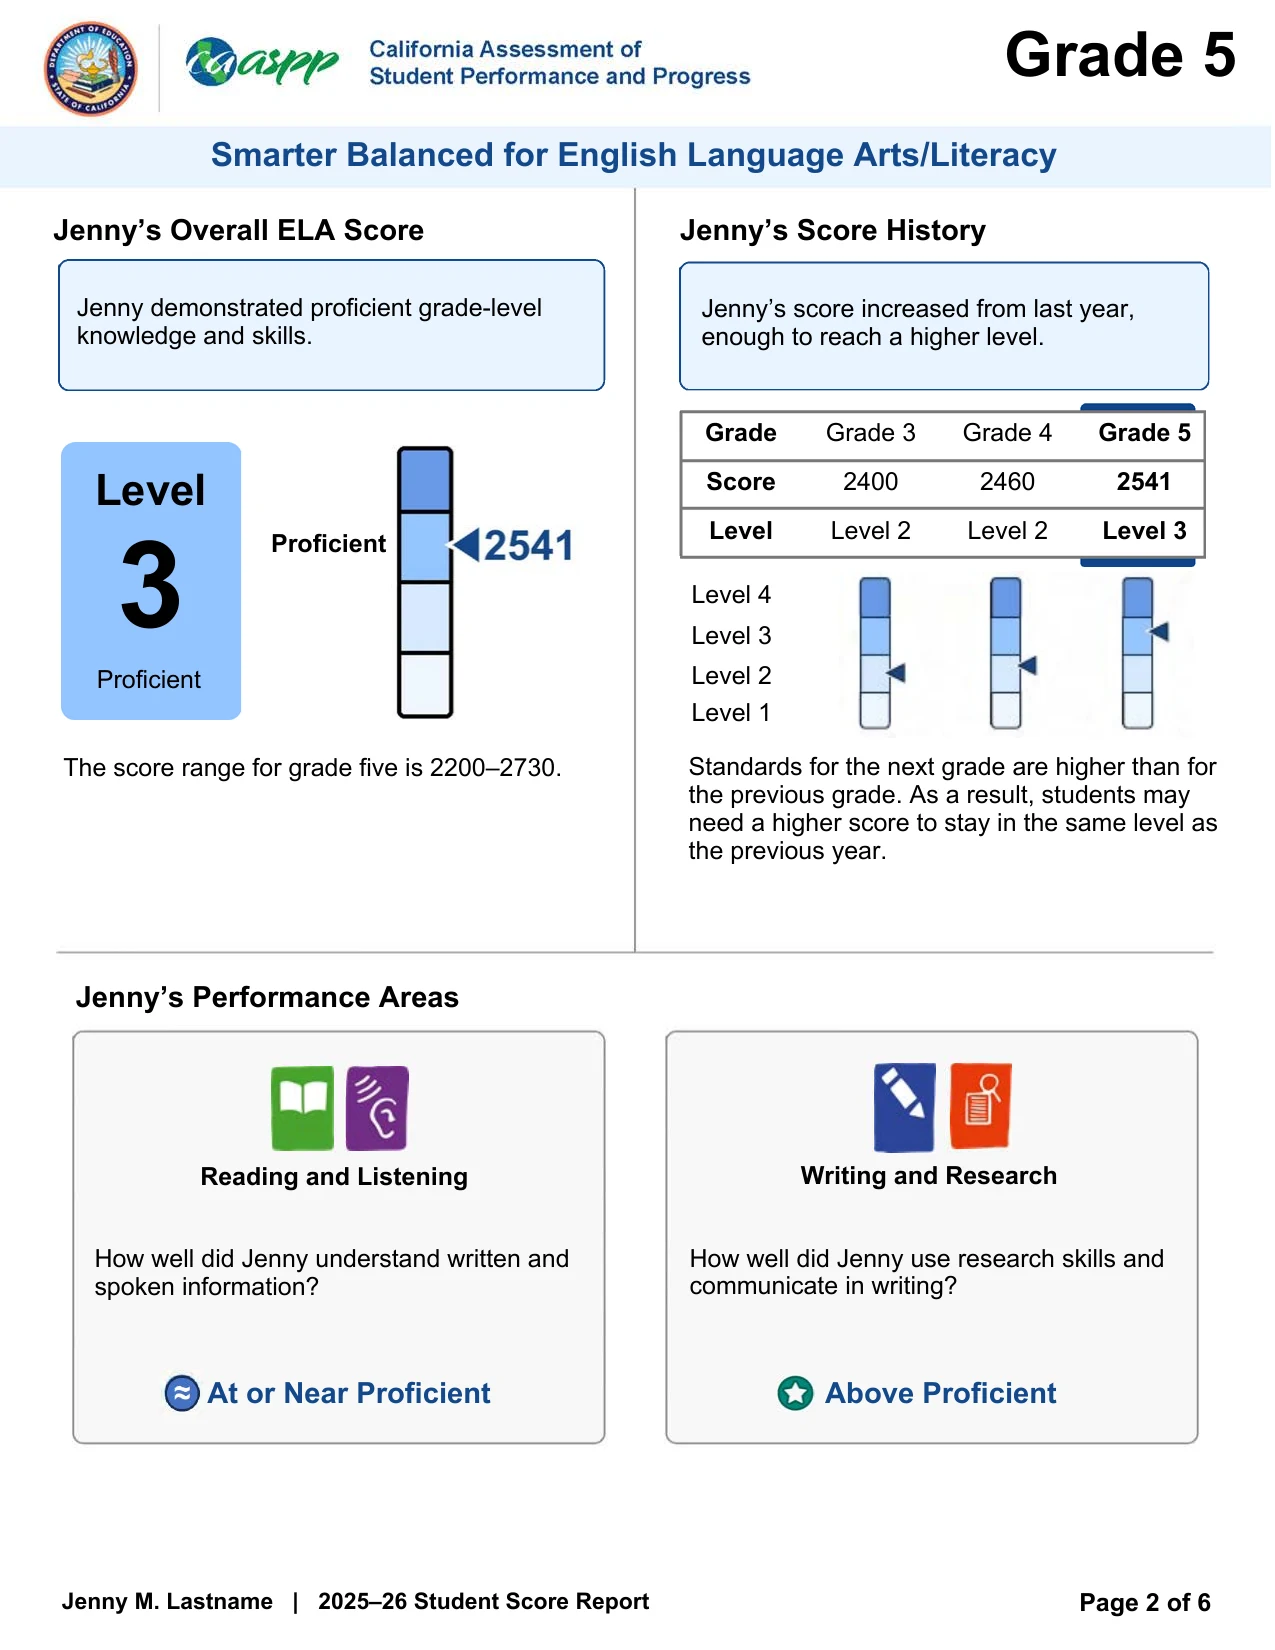
The state’s sample report for a fifth grader, not a real child.
39points
above the Proficient line. 2541 is Proficient (Level 3) in grade 5 English, and 41 points below the Advanced line.
Showing the state’s sample. Type over it with the score beside the level on your child’s report.
- Among California students At or above the 60th percentile and below the 70th, among California fifth graders who took the English test in 2024–25, from the state’s 2024–25 percentile table.
- At this level In 2025–26, 26% of California fifth graders who took the English test scored Proficient.
- Since grade 4 Up 81 points since grade 4, from the Developing level to Proficient. The Proficient line rose 29 points over the same grades, so the score gained 52 points on it.
- The state’s next step For this level, the state’s next-steps flyer suggests chances to build on strengths, such as enrichment, with extra support where your child is still developing, read alongside classwork and what the teacher sees.
Where Proficient starts in each grade The sample report’s scores Middle score of California fifth graders who took the test in 2024–25: 2498, in Level 2, called Standard Nearly Met that year.
Grade 5 English: the four levels
Each step is drawn at its real height. The count is how many of every 100 California fifth graders who tested scored there in 2025–26.
Advanced Level 4
2582–2730 23 in 100
Proficient Level 3
2502–2581 26 in 100
Developing level Level 2
2442–2501 20 in 100
Minimal Level 1
2200–2441 31 in 100
Every tested grade: where Proficient starts
Each column is one grade on one shared scale. The score it takes to reach Proficient climbs with every grade.
Middle scores and percentile comparisons use CDE’s 2024–25 tables. Achievement shares come from a later spring; each comparison shows its own year.
See every grade’s score ranges as a table
| Test and grade | Minimal (Level 1) | Developing level (Level 2) | Proficient (Level 3) | Advanced (Level 4) | Middle score, 2024–25 | Scored below Proficient, 2025–26 |
|---|---|---|---|---|---|---|
| English, grade 3 | 2115–2366 | 2367–2431 | 2432–2489 | 2490–2650 | 2416 | 56% |
| English, grade 4 | 2140–2415 | 2416–2472 | 2473–2532 | 2533–2690 | 2460 | 54% |
| English, grade 5 | 2200–2441 | 2442–2501 | 2502–2581 | 2582–2730 | 2498 | 51% |
| English, grade 6 | 2230–2456 | 2457–2530 | 2531–2617 | 2618–2770 | 2525 | 52% |
| English, grade 7 | 2260–2478 | 2479–2551 | 2552–2648 | 2649–2810 | 2550 | 50% |
| English, grade 8 | 2290–2486 | 2487–2566 | 2567–2667 | 2668–2850 | 2560 | 50% |
| English, grade 11 | 2300–2492 | 2493–2582 | 2583–2681 | 2682–2900 | 2607 | 43% |
| Math, grade 3 | 2190–2380 | 2381–2435 | 2436–2500 | 2501–2660 | 2427 | 53% |
| Math, grade 4 | 2205–2410 | 2411–2484 | 2485–2548 | 2549–2700 | 2464 | 58% |
| Math, grade 5 | 2220–2454 | 2455–2527 | 2528–2578 | 2579–2740 | 2486 | 64% |
| Math, grade 6 | 2235–2472 | 2473–2551 | 2552–2609 | 2610–2780 | 2508 | 62% |
| Math, grade 7 | 2250–2483 | 2484–2566 | 2567–2634 | 2635–2820 | 2518 | 63% |
| Math, grade 8 | 2265–2503 | 2504–2585 | 2586–2652 | 2653–2860 | 2523 | 64% |
| Math, grade 11 | 2280–2542 | 2543–2627 | 2628–2717 | 2718–2900 | 2548 | 68% |
| Science (CAST), grade 5 | 150–178 | 179–213 | 214–230 | 231–250 | 201 | 64% |
| Science (CAST), grade 8 | 350–377 | 378–414 | 415–432 | 433–450 | 400 | 64% |
| Science (CAST), high school | 550–575 | 576–614 | 615–635 | 636–650 | 601 | 63% |
For your school’s results and the statewide picture, see 2026 CAASPP results: what changed across California?
How exact is the number? Uneven steps, measurement error and the state’s sample
The steps aren’t the same height. In grade 5 English, Minimal covers 242 points, from 2200 to 2441. The Developing level covers 60, from 2442 to 2501 (state score ranges). Two children can both come home Minimal and sit 241 points apart, while 60 points is the whole width of the Developing level.
Near a line, the number is less exact than it looks. Every test score carries some measurement error. Smarter Balanced makes California’s English and math tests; you may see it called SBAC. It says a level “should be interpreted with some caution, especially if the score is less than a standard error from the achievement level boundary” (Smarter Balanced). California gives a shorter version of the test (CDE). On it, the error near a cutoff runs about 23 to 42 points, depending on the grade, the subject and the line (2023–24 technical report, Tables 8.25 and 8.26). Your child’s report doesn’t print it. The staircase draws it as a small bar beside the dot.
That error is large next to the steps. In grade 5 English, every score in the Developing level sits within about 30 points of a line. The error near both of those lines is about 32.
The state’s sample report has a good example. Its fifth grader scored 2520 in math. That’s in the Developing level, 8 points under the Proficient line, well inside the roughly 26 points Smarter Balanced estimates for that line. The same score is at or above the 60th percentile of California fifth graders who took the math test in 2024–25 (CDE percentiles). In other words, it matched or beat the scores of about 60 in 100 of them. Switch the staircase to Math to see it, whisker and all.
The level needs no date, because the cutoffs between levels haven’t moved. The percentiles and the statewide shares in the staircase each carry a school year. They come from the state’s yearly percentile table and its yearly statewide results. Both come out in the fall or later, after most reports have reached families.
When do 2026 CAASPP scores come out?
Your child’s report and the public results are two different releases, months apart.
If you’re waiting on your own child’s scores, you want the first one.
- The state sends your child’s report to your district.Reports go out daily from late May. The state’s estimated final dates are mid-August for Smarter Balanced and science, and late August for the alternate tests.
- Your district passes it to you.The deadline is 20 working days after the district receives it. If it arrived after the last day of instruction, the deadline becomes the first 20 working days of the next school year.
- The public results come out separately.The 2026 public test results and downloadable files were released on October 15, 2026. Growth data follows on December 15, 2026. Neither one is your child’s report.
Sources: state reporting timeline, district delivery rule and public release schedule.
When the summer deadline falls, and what to check if it hasn’t come
So expect the report any time from June into the fall, depending on when your district got the file. The summer rule leaves one thing open: when the “next school year” starts. California’s school year officially begins on July 1 (Education Code 37200), and classes start weeks later. Twenty working days is about four weeks. If the count starts on July 1, the deadline falls in the summer. If it starts with classes, it falls about four weeks in. Either way, a report the district got over the summer should reach you by about the fourth week of classes. That’s our reading and our arithmetic, not a date the state publishes.
Still waiting? Check your district’s parent portal first, then your email, including spam, then the mail. If it isn’t there, ask the school office how the report was sent. Then ask what date the district received the file. That date starts the clock, and it decides which of the two deadlines applies.
What do the 2026 CAASPP score labels mean?
Each new name is an old level number in new words.
Advanced was Standard Exceeded (Level 4). Proficient was Standard Met (Level 3). The Developing level was Standard Nearly Met (Level 2). Minimal was Standard Not Met (Level 1). The state’s reporting guide says the criteria and cut scores for each level stayed the same. The new descriptions say a student at each level shows a sophisticated, thorough, initial or limited understanding of their grade’s skills.
Old names, the smaller results, why California changed the names, and “Proficient” on other tests
A 2024–25 report said Standard Nearly Met where a 2025–26 report names the Developing level. The state’s family flyer puts it plainly: “Only the reporting labels and descriptions are changing. The test questions, format, and scoring stay the same.” That’s why the staircase marks each step with its level number, which reports from earlier years share.
Advanced isn’t a label for working above grade level. Every question on the test measures standards for your child’s grade (state notice), so Advanced is the top category on a grade-level test. The Developing and Minimal levels describe how a child did on that same grade-level material.
The smaller results under each subject changed names too. Your report splits English into areas like Reading and Listening, and math into areas like Concepts and Procedures. Those used to read Above, Near or Below Standard. They now read “Above Proficient,” “At or Near Proficient” and “Below Proficient.”
Why did California change the names?
The California State Board of Education adopted the new names, and the state’s notice gives the reason. It wanted to correct “the inaccurate perception that Level 3 represents a grade-level cutoff, and students scoring below Level 3 were ‘below grade level.’” The family flyer adds that California adopted the new descriptors in 2025, for reports starting with the 2025–26 school year.
In a 2022 study, O’Donnell and Sireci asked 51 teachers and 50 parents about 73 achievement-level labels. Labels for the same level of performance read differently in tone and in how much achievement they seemed to convey. Some came across as more encouraging, or clearer, than others. We read the change as moving the question from “did my child clear a bar?” to “what did my child show?”
Does “Proficient” mean the same thing on every test?
No, so keep the test attached to the word. NAEP, also called the Nation’s Report Card, is a federal test. It tests a sample of students and never sends a child or a school a score (CDE). Its Proficient level “does not signify meeting grade level expectations,” which states set with their own tests (NCES). Texas’s STAAR test has four levels too. It counts Approaches Grade Level or higher as passing (Texas Education Agency). California’s Developing level doesn’t become Texas’s Approaches level just because both sit third from the top.
So say the whole thing: “Proficient on California’s grade 5 math test.” That keeps one result from turning into a label for the child.
Is your child keeping up from year to year?
Staying in the same level from one year to the next takes a higher score, because the bar rises every grade.
The report says so itself, under the score history: “Standards for the next grade are higher than for the previous grade. As a result, students may need a higher score to stay in the same level as the previous year” (sample report).
The state’s sample, what counts as a big gain, and comparing older reports
The state’s sample shows how this looks. Its English scores went 2400, 2460, then 2541 across grades 3, 4 and 5: the Developing level twice, then Proficient. The label sat still for a year while the number climbed 60 points. In grade 5, 81 more points carried it past the Proficient line, which rose 29 points between grades 4 and 5. In the staircase, that’s the ink dots climbing faster than the step line where Proficient starts. The math page of the same report shows the other case: the score “increased from last year, but not enough to reach a higher level.”
Whether 81 points is a lot depends on how much children who started near 2460 usually gain. Smarter Balanced says that’s what you’d need to judge it: “the student’s initial score and how much growth other students with the same initial score tend to exhibit” (Smarter Balanced). Your child’s report doesn’t carry that comparison, and the staircase doesn’t either. California runs it for schools and groups of students.
Can you compare a 2026 score with an older score?
Yes. The cutoffs between levels are the same in the state’s older and current score tables. A 2019 Standard Met, a 2023 Standard Met and a 2026 Proficient are the same level. The only change, made for the 2020–21 tests, was to the lowest and highest possible scores (state score ranges). The state also says results from the shorter test it has given since then can be compared with the longer test’s (CDE). Compare old and new reports by level number.
For how California’s students as a whole have scored since 2015, by grade and level, see our 2026 results article. That’s the state’s picture, not your child’s, but it can help when a hard year feels like it was only yours.
How should you read your child’s score report?
Read English and math separately, then put the report next to recent classwork.
A child can have a very different story in each subject. Ask the teacher which subject looks stronger in class.
Which CAASPP tests does your child take?
CAASPP is California’s testing system, and it holds several tests. Smarter Balanced English and math come in grades 3 to 8 and 11. The California Science Test, or CAST, comes in grades 5 and 8 and once in high school. It has its own scale (150 to 250 in grade 5), and the staircase has a science tab for it. Students with the most significant cognitive disabilities may take the California Alternate Assessments instead, when their IEP team chooses them. Those use three levels of their own (CDE), and the new names apply only to Smarter Balanced and CAST (state notice).
There’s no statewide English or math test in grades 1 or 2. An English learner in their first 12 months in a U.S. school may be exempted from the English test for that year, and still takes math (CDE).
What is a CAASPP Student Score Report?
It’s your child’s private report from the state, two to six pages long depending on the tests taken. SchoolScope doesn’t have your child’s report; we work from the state’s public results for groups of students.
Everything the report shows, including Lexile and Quantile
The 2025–26 sample shows each test’s scale score and level, the score history, and results for the smaller areas of each subject. It also shows the essay’s three trait scores and a box comparing your child’s score with the school and state averages. Lexile and Quantile measures appear too. They estimate the reading level and the math skills your child is ready for (sample report).
Read it in this order:
- The level and the number: 2541, Level 3, Proficient. The page marks 2541 with an arrow on a four-step bar and gives the grade 5 range, 2200 to 2730. It doesn’t print the cutoffs, so it can’t tell you how far 2541 is from either line. The staircase does that part.
- The history: 2400, 2460, 2541. Check whether the number rose by more or less than the bar did.
- The performance areas, such as Reading and Listening or Writing and Research, each marked Above, At or Near, or Below Proficient. Use them to form questions.
- The teacher, with the report and a couple of recent assignments in hand.
Why the smaller areas deserve less weight
Give those performance areas less weight than the overall score. Each one rests on fewer questions. Smarter Balanced says “the measurement error of subscores is relatively large because fewer items are used” (Smarter Balanced). The shorter test California gives has about half as many adaptive questions, so each area rests on even fewer (test design). A “Below Proficient” in Writing and Research is enough to start a conversation. It’s too thin to decide that your child struggles with writing.
The state gives the same advice: read results “in combination with other important performance measures, such as report cards, grades received on class assignments, and other teacher feedback” (CDE).
What should you do if the score surprises or worries you?
Any result is worth a conversation with the teacher. It calls for a plan when other evidence points the same way.
A level that matches what you see in homework and report cards doesn’t, on its own, ask for anything new.
When to look closer, the state’s questions and its next steps by level
A score the staircase marks as near a line says less about the level than the word does. The child could have landed on the other side. The Developing level is common too. It’s Level 2, where the middle California score fell in grades 3 to 8 in 2024–25, when the level was called Standard Nearly Met. The state still pairs it with tailored teaching support.
Look closer in three cases: the report and the classwork point at the same gap, one subject drops a level while the other holds, or the teacher has noticed what you’ve noticed. We’d bring two pieces of recent work to that conversation and ask the teacher where they agree with the report.
The state wrote a question guide for exactly this. For your child, it suggests asking, “Did the test reflect the work you do in class? Why or why not?” For the teacher, it suggests “How do these results match what my child does in class?” and “How are these results used to support students, and what are the next steps for my child?”
The state also publishes next steps for each level, in English and math flyers from April 2026. Each suggestion starts from “additional performance information,” meaning classwork and what the teacher sees. At Advanced, it suggests challenging projects and problem-solving tasks. At Proficient, enrichment that builds on strengths, plus support where your child is still developing. At the Developing level, a clear look at strengths and areas to grow, with teaching support tailored to them. At Minimal, focused time and personal support on the essential skills for the grade. If your child is already at Advanced, raise that first suggestion: what does the class offer a child who finds the work easy?
If the teacher and the report disagree, talk through the difference before buying tutoring. Find out, too, what help the school already runs for that subject. If outside help still makes sense, our guide to low school scores covers what the tutoring research found.
What is different in grade 11?
Grade 11 English and math results can place a student in first-year courses at California State University.
This is the Early Assessment Program, or EAP. Students decide whether to release their results to CSU, separately for English and for math. Releasing them doesn’t affect admission: CSU uses them only for placement after a student is admitted (CDE). Students who didn’t release results at the end of the test can send a copy of the report later. It can go to CSU or to a California community college.
What each level means for CSU placement, subject by subject:
- Advanced: enrolls in the standard first-year college-level course.
- Proficient: the same, after an approved year-long grade 12 course in that subject with a C- or better, so the senior-year schedule matters.
- The Developing or Minimal level: placed in a supported college-level course, with extra help built in, unless other measures, including coursework and GPA, exempt the student.
Some, but not all, community colleges accept EAP results, so check with the college. Treat the status as early planning information a year ahead of college.
How does your child’s score relate to the school’s results?
The school results you see on SchoolScope describe groups of children, and your child’s report describes one. The state’s public files combine tested students by school, grade, subject and student group. They withhold any group of 10 or fewer students so no child’s result can be picked out (Education Code 60641).
Missing results, and the growth comparison your child’s report can’t make
A missing result isn’t a zero. On SchoolScope a missing value prints as a dash, and a real zero prints as 0. A dash can mean the school doesn’t serve that grade, the group was too small, or no result was published. Our methodology explains the sources and their limits.
Each year’s fifth-grade percentage describes a mostly different set of children, so a rise doesn’t mean any child improved. California does follow the same students, in grades 4 to 8. Its student-by-student growth measure gives a school the points its students scored above or below what the state expected from their earlier scores (CDE). That’s the comparison your child’s report can’t make. We show it on school profiles where the state publishes it. We leave it out of the Scope Score, and our methodology explains why. The 2026 growth files are scheduled for December 15.
Look up your child’s school to see its results by grade and subject. If a low school result is what worried you, start with what a low school score can and can’t mean. If two schools show similar totals, the split between Advanced and Proficient shows what the total can hide.
Then ask the teacher how they help when your child gets stuck.