2026 CAASPP Scores: Ranges, Levels, and When Results Arrive
Based on 7 cited sources
California changed the four performance labels on 2025–26 CAASPP reports. Advanced, Proficient, Developing, and Minimal replace the old labels on the standard English, math, and science tests. The sentence describing each level was rewritten too, and the labels on the subject-area detail changed with them. What did not change: the scale scores and the cutoffs between levels.
On this page▾
If this is your first CAASPP report, here's what your child actually took and when it arrives.

Which CAASPP tests does your child take?
CAASPP stands for the California Assessment of Student Performance and Progress. It is an umbrella system with several state tests, not the name of one test.
The standard English and math tests are Smarter Balanced, given in grades 3, 4, 5, 6, 7, 8, and 11. They are part of CAASPP. There is no statewide summative English or math test in grades 1 or 2. One exception, if it applies to your child: an English learner in their first 12 months of school in the United States can be exempted from the English test for that year. It is an exemption the school may apply, not an automatic skip — the student can still take it. Either way they take math. The state explains the full California assessment system here.
The California Science Test (CAST) is a separate test inside CAASPP. Students take it in grades 5 and 8, then once in high school. The high school test can fall in grade 10, 11, or 12. Students with the most significant cognitive disabilities take the California Alternate Assessments instead, when their IEP team decides an alternate assessment is right for them. Those reports use three levels, not four: understanding, foundational understanding, and limited understanding. The renaming did not touch them.
CAASPP is California's own testing system. The federal one — NAEP, the Nation's Report Card — tests a sample of schools and sends a score to no child and no school, including yours.
After testing, families receive a private Student Score Report with their child's individual results.
What is a CAASPP Student Score Report?
It shows results for the statewide tests your child took. Smarter Balanced English and math results appear for students in grades 3, 4, 5, 6, 7, 8, and 11. The report includes scale scores, performance levels, subject details, and score history. When CAST applies, the science result appears with English and math if the child took both, or in a CAST-only report.
When do 2026 CAASPP scores come out?
Your child's report and the public results are two different releases, months apart. Most parents asking this question want the first one.
- Your child's report reaches your district — not you. Daily from late May. The state estimates the last Smarter Balanced and CAST reports for mid-August, and the alternate assessments for late August.
- Your district passes it to you. Two deadlines, and which one applies depends on when the district got it. If it arrived while school was still in session: within 20 working days of receipt. If it arrived after the last day of instruction: by the first 20 working days of the next school year.
- Statewide and school-level results go public. October 15. That release is for everyone, and it is not your child's report.
So: expect it any time from June into the autumn. Which end you land on depends on when your district received the file. The state sends reports to districts daily from late May (release timeline), and California's rule then gives districts 20 working days to pass them on — unless the file landed after the last day of instruction, in which case the deadline is not extended but reset, to the first 20 working days of the new school year. For a district starting in mid-August, that lands around mid-September.
If you don't have it yet: check the parent portal first. Many districts post the report there and mail nothing, so that is where it usually sits unopened. Then email, including spam, then physical mail. Still nothing? Ask the school office which of the three they used, and — this is the question that settles it — what date the district received the file from the state. That date is what starts the clock, and which of the two deadlines applies depends on whether school was still in session when it arrived. Once the applicable deadline has passed, it is worth raising with the district office.
October 15 is the public release, not yours. The California School Dashboard lands the same day with school and district figures. When you see an October news story about statewide California test scores, that is usually this release rather than anything to do with your child's report.
One thing the report leaves out: your child's percentile. It prints a scale score and a level, and California publishes the percentile tables separately. The chart below puts the two together — and there is a timing quirk in that which is worth understanding once, because it applies to every comparison on this page.
Your child's number is from this year. The most recent statewide picture is from last year. The report in your hand is 2025–26. California will not publish 2025–26 statewide results until October 15, so the newest statewide figures anyone has — us included — are 2024–25. (Older years exist and are comparable; the trend further down runs back to 2019.) That affects the three things below differently, and the difference matters:
- Which level the score falls in — unaffected, and exact. The cutoffs have not moved since 2020–21. A 2541 in grade 5 English is Proficient this year, last year, and in 2021.
- The percentile and the state average — last year's. A good guide to where a score sits, and not an official 2025–26 percentile. Nobody has one of those yet.
- The share of students at each level — last year's, for the same reason.
Nothing here is a workaround; it is simply how the calendar runs. Your report arrives months before the statewide picture it belongs to.
When the report arrives, you may see Developing where an older report said Standard Nearly Met. It sounds like the score changed, or maybe the test did. It did not. California changed the names on 2025–26 reports without moving the score cutoffs.
What do the 2026 CAASPP score labels mean?
Starting with 2025–26 results, the California Department of Education renamed the four reporting levels on Smarter Balanced and the science test in its May 2026 notice. The criteria and cut scores stayed the same, so a result at a given level still compares across years. The table below has the full mapping.
| Level | Old label, through 2024–25 | New label, starting 2025–26 | In plain English |
|---|---|---|---|
| 4 | Standard Exceeded | Advanced | Shows a sophisticated grasp of grade-level knowledge |
| 3 | Standard Met | Proficient | Shows a thorough grasp of grade-level knowledge |
| 2 | Standard Nearly Met | Developing | Shows an initial grasp of grade-level knowledge |
| 1 | Standard Not Met | Minimal | Shows a limited grasp of grade-level knowledge |
The subject-area labels changed too. Below the overall result, your report breaks each subject into areas. Those areas used to read Above Standard, Near Standard, and Below Standard. On 2025–26 reports they read Above Proficient, At or Near Proficient, and Below Proficient. Same three levels, same cutoffs, new words chosen to match the new overall labels. Area results still compare year to year.
Advanced does not mean your child is working above grade level. It is the highest performance category on this grade-level test. That distinction matters when you talk with a child who reads the label as a verdict on how smart they are.
What scale score falls in each level?
Alongside the word, the report carries a number — the scale score. That is the state's numerical estimate of what your child can do; the word is the bucket it fell into. The buckets are not the same size. Set the chart below to your child's grade and subject.
California statewide · 2024–25, the most recent published
The four labels don’t cover equal ground.
Your child’s report gives a number and one of four words. The words are drawn below across the stretch of the number line each one actually covers — pick the grade and subject on the report. The two middle labels are the narrowest in every grade and both subjects, which means a label tells you most about a child near the middle and least about a child at either end.
In grade 3 English, Minimal covers 252 points and Proficient covers 58. Two children at opposite ends of Minimal sit 251 points apart.
In grade 4 English, Minimal covers 276 points and Developing covers 57. Two children at opposite ends of Minimal sit 275 points apart.
In grade 5 English, Minimal covers 242 points and Developing covers 60. Two children at opposite ends of Minimal sit 241 points apart.
In grade 6 English, Minimal covers 227 points and Developing covers 74. Two children at opposite ends of Minimal sit 226 points apart.
In grade 7 English, Minimal covers 219 points and Developing covers 73. Two children at opposite ends of Minimal sit 218 points apart.
In grade 8 English, Minimal covers 197 points and Developing covers 80. Two children at opposite ends of Minimal sit 196 points apart.
In grade 11 English, Advanced covers 219 points and Developing covers 90. Two children at opposite ends of Advanced sit 218 points apart.
In grade 3 math, Minimal covers 191 points and Developing covers 55. Two children at opposite ends of Minimal sit 190 points apart.
In grade 4 math, Minimal covers 206 points and Proficient covers 64. Two children at opposite ends of Minimal sit 205 points apart.
In grade 5 math, Minimal covers 235 points and Proficient covers 51. Two children at opposite ends of Minimal sit 234 points apart.
In grade 6 math, Minimal covers 238 points and Proficient covers 58. Two children at opposite ends of Minimal sit 237 points apart.
In grade 7 math, Minimal covers 234 points and Proficient covers 68. Two children at opposite ends of Minimal sit 233 points apart.
In grade 8 math, Minimal covers 239 points and Proficient covers 67. Two children at opposite ends of Minimal sit 238 points apart.
In grade 11 math, Minimal covers 263 points and Developing covers 85. Two children at opposite ends of Minimal sit 262 points apart.
Every grade and both subjects, as a table
| Grade | Subject | Minimal | Developing | Proficient | Advanced |
|---|---|---|---|---|---|
| 3 | English | 2115–2366 | 2367–2431 | 2432–2489 | 2490–2650 |
| 4 | English | 2140–2415 | 2416–2472 | 2473–2532 | 2533–2690 |
| 5 | English | 2200–2441 | 2442–2501 | 2502–2581 | 2582–2730 |
| 6 | English | 2230–2456 | 2457–2530 | 2531–2617 | 2618–2770 |
| 7 | English | 2260–2478 | 2479–2551 | 2552–2648 | 2649–2810 |
| 8 | English | 2290–2486 | 2487–2566 | 2567–2667 | 2668–2850 |
| 11 | English | 2300–2492 | 2493–2582 | 2583–2681 | 2682–2900 |
| 3 | Math | 2190–2380 | 2381–2435 | 2436–2500 | 2501–2660 |
| 4 | Math | 2205–2410 | 2411–2484 | 2485–2548 | 2549–2700 |
| 5 | Math | 2220–2454 | 2455–2527 | 2528–2578 | 2579–2740 |
| 6 | Math | 2235–2472 | 2473–2551 | 2552–2609 | 2610–2780 |
| 7 | Math | 2250–2483 | 2484–2566 | 2567–2634 | 2635–2820 |
| 8 | Math | 2265–2503 | 2504–2585 | 2586–2652 | 2653–2860 |
| 11 | Math | 2280–2542 | 2543–2627 | 2628–2717 | 2718–2900 |
Two things follow, and both are worth taking to a teacher.
The label says least about a child at either end of the scale. The two middle labels are the narrowest in every grade and both subjects. In grade 5 English, Developing covers 60 points and Minimal covers 242 — so two children can both come home Minimal and sit 241 points apart, while 60 points is the whole width of Developing.
Watch the number across years, not the word. The bands are wide, and their edges are reporting cutoffs rather than sharp boundaries in what children know — so the scale score carries more than the label does. That is why the report prints a score history.
Read it carefully, though. Holding the same level two years running does mean a child kept their place against a bar that rises each grade. It does not tell you whether they grew more or less than children who started where they started — for that, Smarter Balanced says you need the starting score and how much growth is typical from it. California measures that separately, in grades 4 through 8, and we show it on school profiles where the state publishes it. It is not on your child's report.
And be careful with a small gap near a cutoff. Every score carries measurement error, and how much varies by test and by where the score falls. Smarter Balanced puts it plainly: a result "should be interpreted with some caution, especially if the score is less than a standard error from the achievement level boundary." A child sitting a few points either side of a line may be telling you the line was nearby rather than anything about themselves.
How should you read your child's score report?
Start with the overall level, then read the performance areas as a hint about where to ask questions. Here is the state's own sample report — the English page for a fifth grader, exactly as California publishes it.
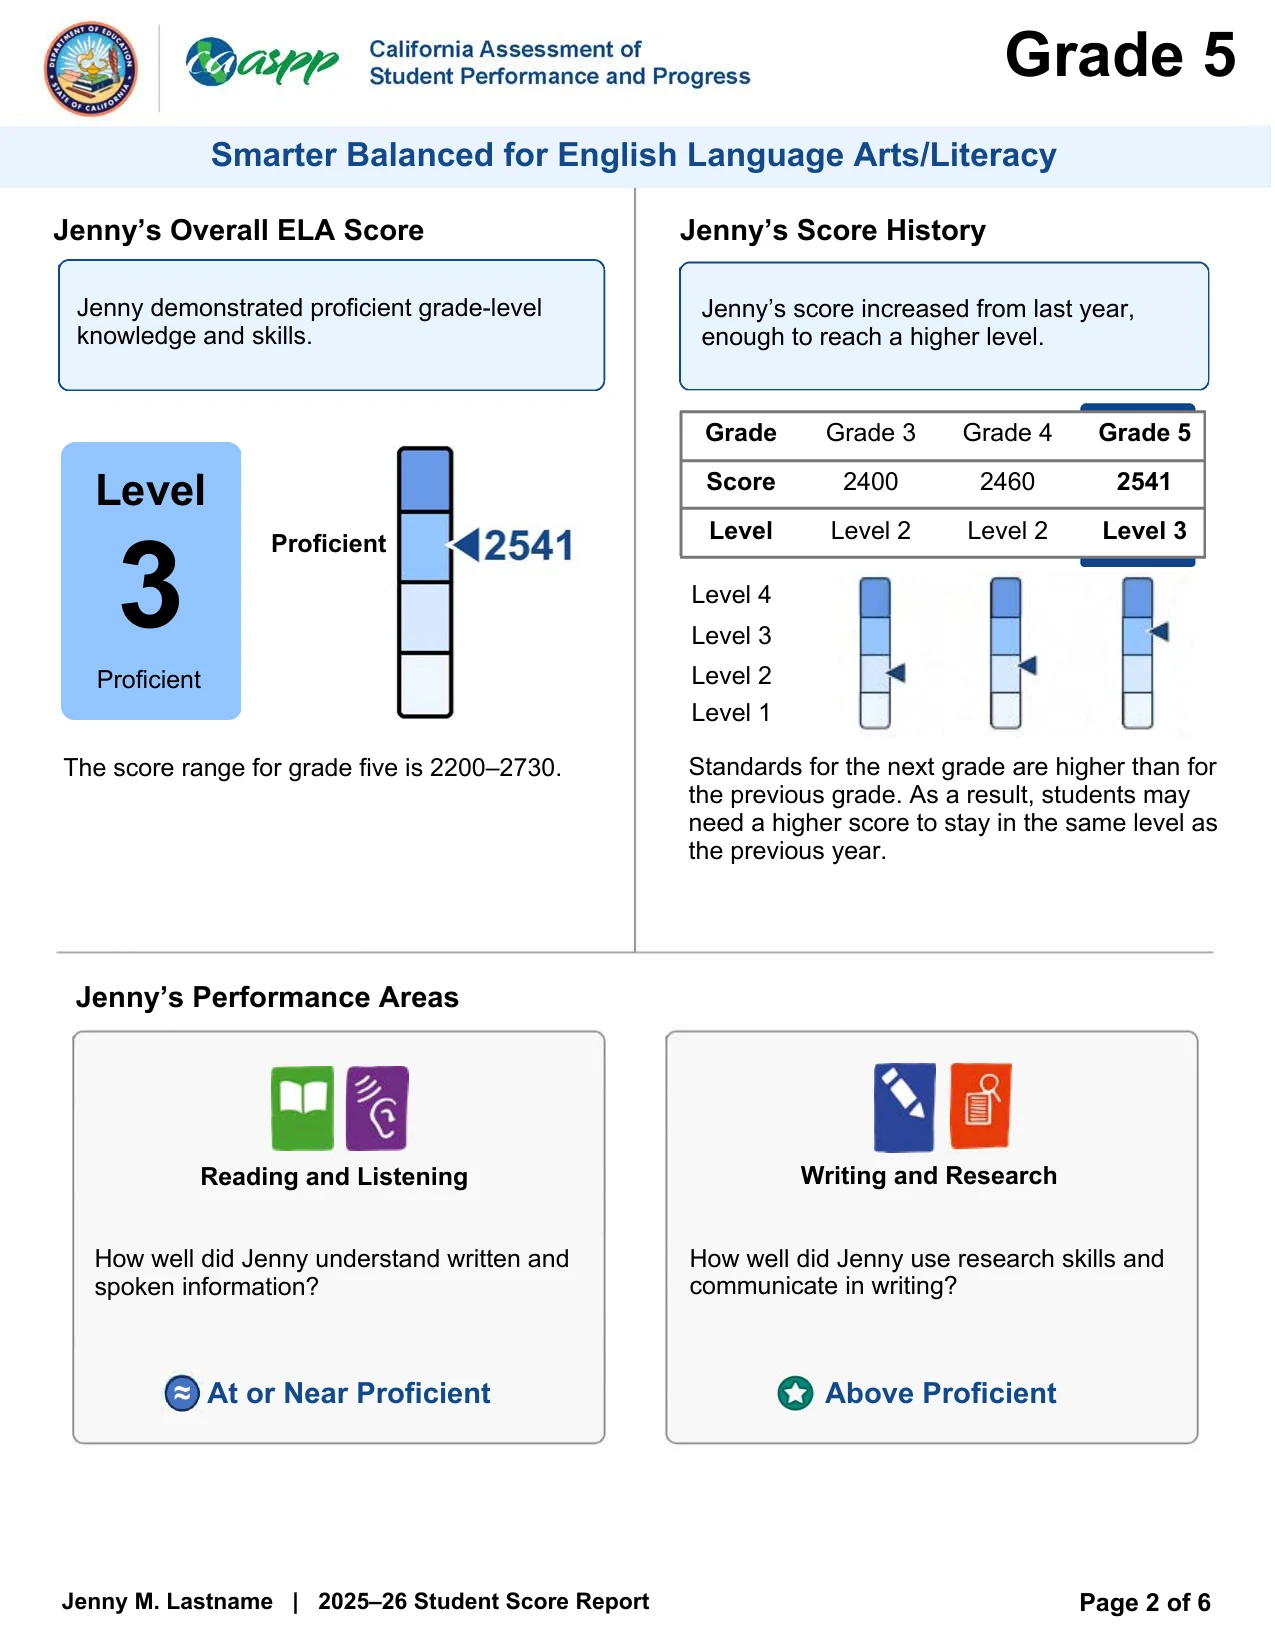
Four things on that page do most of the work.
- The level and the number. "Level 3 Proficient" is the headline; 2541 is the measurement. The page gives the grade-five range as 2200–2730 and says nothing more about where 2541 sits inside it. That is what the chart above is for.
- The score history. Here it reads 2400, 2460, 2541 across grades 3, 4 and 5 — Level 2, Level 2, then Level 3. The most useful panel on the report, and the one parents skip. The label sat still for a year while the number climbed 60 points.
- The performance areas. Reading and Listening, Writing and Research, each marked Above, At or Near, or Below Proficient. How much weight to put on them is the next section.
- What is missing. No percentile. No comparison to other children beyond a school and state average further in.
California publishes sample reports for grade 5 and grade 11 in English and Spanish, plus versions for the alternate assessments and the Summative ELPAC.
Try this order:
- Look at English language arts and math separately. A child can have a very different story in each.
- Find the Performance Areas — Reading and Listening, Writing and Research for English; Concepts and Procedures, Mathematical Practices for math. Each is marked Above, At or Near, or Below Proficient. Read them as broad hints. A few years back, Smarter Balanced cut the adaptive part of the test by about half and left the performance task as it was. So any single area rests on far fewer questions than the overall score does. That's enough to point you toward a question for the teacher. It is not enough to conclude your child is bad at writing.
- Compare it with class assignments, grades, and the teacher's feedback.
- Ask the teacher whether the result fits what they see in class. Ask what to work on next.
The California Department of Education gives the same basic advice: read CAASPP results alongside report cards, class assignments, and teacher feedback. If those sources disagree, ask the teacher before you use a school comparison site or buy a tutoring package. The disagreement may tell you more than the label. For grade 11, the report also carries college-planning information.
Why did California change the names?
California says the change corrects an inaccurate cutoff assumption. Its May 2026 notice says Level 3 isn't a cutoff that makes every child below it "below grade level." Every test item measures standards for the student's grade. The levels show a range of understanding and complexity.
The new words shift the emphasis from whether a child "met" a line to what the child showed on the test. That is our reading of the change, but the words are not trivial. A 2022 survey of 51 teachers and 50 parents backs that up: O'Donnell and Sireci found that labels for the same level of performance were read differently in tone and in how much achievement they seemed to convey. Some read as more encouraging, or clearer, than others.
We looked for a scoring change behind the new words and found none. The state's reporting guide says the cut scores and criteria stayed put. A score that landed in Standard Nearly Met now lands in Developing.
Can you compare a 2026 score with an older score?
Yes. The level numbers and cut scores still line up across years. Advanced maps to Standard Exceeded, Proficient to Standard Met, Developing to Standard Nearly Met, and Minimal to Standard Not Met.
That holds further back than the renaming. California moved the lowest and highest obtainable scores before 2020–21, but every cut score between levels stayed put — so the share of students at each level compares directly across years.
California statewide · 2019–2025
Minimal grew in every grade. Proficient shrank in every one.
Each bar is one year’s students, split across the same four levels. A different set of children sits the test each year, so this is the shape of a grade in California, not any child’s progress. Switch grade and subject and the same pattern holds in every one — fourteen grade-and-subject combinations plus both all-grade totals: the bottom band is bigger than it was in 2019, the Proficient band is smaller, and the share reaching Advanced is close to where it started.
All grades, English, 2019 to 2025: Minimal up 2.8 points, Proficient down 2.1, Advanced down 0.2.
Grade 3, English, 2019 to 2025: Minimal up 4.6 points, Proficient down 2.0, Advanced down 2.4.
Grade 4, English, 2019 to 2025: Minimal up 3.5 points, Proficient down 2.2, Advanced down 1.6.
Grade 5, English, 2019 to 2025: Minimal up 3.1 points, Proficient down 2.5, Advanced down 0.4.
Grade 6, English, 2019 to 2025: Minimal up 2.9 points, Proficient down 2.7, Advanced up 0.8.
Grade 7, English, 2019 to 2025: Minimal up 2.2 points, Proficient down 2.5, Advanced up 0.8.
Grade 8, English, 2019 to 2025: Minimal up 2.6 points, Proficient down 2.1, Advanced up 0.6.
Grade 11, English, 2019 to 2025: Minimal up 1.2 points, Proficient down 0.6, Advanced up 0.3.
All grades, math, 2019 to 2025: Minimal up 4.1 points, Proficient down 2.1, Advanced down 0.3.
Grade 3, math, 2019 to 2025: Minimal up 5.1 points, Proficient down 2.9, Advanced down 1.0.
Grade 4, math, 2019 to 2025: Minimal up 4.8 points, Proficient down 2.5, Advanced down 0.2.
Grade 5, math, 2019 to 2025: Minimal up 3.9 points, Proficient down 1.2, Advanced down 0.8.
Grade 6, math, 2019 to 2025: Minimal up 4.7 points, Proficient down 2.5, Advanced up 0.6.
Grade 7, math, 2019 to 2025: Minimal up 3.1 points, Proficient down 1.8, Advanced up 0.0.
Grade 8, math, 2019 to 2025: Minimal up 3.7 points, Proficient down 1.9, Advanced down 0.8.
Grade 11, math, 2019 to 2025: Minimal up 3.1 points, Proficient down 2.1, Advanced up 0.4.
Every year, grade and subject, as a table
| Subject | Grade | Year | Minimal | Developing | Proficient | Advanced |
|---|---|---|---|---|---|---|
| English | All grades | 2019 | 26.6% | 22.3% | 28.6% | 22.5% |
| English | All grades | 2022 | 30.3% | 22.6% | 26.6% | 20.5% |
| English | All grades | 2023 | 31.2% | 22.2% | 25.9% | 20.7% |
| English | All grades | 2024 | 31.1% | 21.8% | 26.0% | 21.0% |
| English | All grades | 2025 | 29.4% | 21.8% | 26.5% | 22.3% |
| English | Grade 3 | 2019 | 28.0% | 23.4% | 22.2% | 26.4% |
| English | Grade 3 | 2022 | 35.3% | 22.6% | 19.4% | 22.8% |
| English | Grade 3 | 2023 | 34.6% | 22.4% | 19.6% | 23.4% |
| English | Grade 3 | 2024 | 34.6% | 22.6% | 19.6% | 23.2% |
| English | Grade 3 | 2025 | 32.6% | 23.1% | 20.2% | 24.0% |
| English | Grade 4 | 2019 | 31.2% | 19.4% | 22.6% | 26.9% |
| English | Grade 4 | 2022 | 35.6% | 20.2% | 20.7% | 23.5% |
| English | Grade 4 | 2023 | 36.9% | 19.4% | 19.7% | 24.0% |
| English | Grade 4 | 2024 | 37.0% | 19.1% | 19.7% | 24.2% |
| English | Grade 4 | 2025 | 34.7% | 19.6% | 20.4% | 25.3% |
| English | Grade 5 | 2019 | 28.4% | 19.9% | 28.0% | 23.7% |
| English | Grade 5 | 2022 | 32.6% | 20.3% | 25.6% | 21.4% |
| English | Grade 5 | 2023 | 33.4% | 19.9% | 24.8% | 21.9% |
| English | Grade 5 | 2024 | 33.2% | 19.4% | 25.2% | 22.2% |
| English | Grade 5 | 2025 | 31.5% | 19.7% | 25.6% | 23.3% |
| English | Grade 6 | 2019 | 25.4% | 24.6% | 31.2% | 18.9% |
| English | Grade 6 | 2022 | 29.6% | 25.4% | 28.1% | 17.1% |
| English | Grade 6 | 2023 | 30.8% | 25.0% | 27.3% | 16.9% |
| English | Grade 6 | 2024 | 29.9% | 24.3% | 27.7% | 18.1% |
| English | Grade 6 | 2025 | 28.3% | 23.6% | 28.4% | 19.6% |
| English | Grade 7 | 2019 | 26.4% | 22.2% | 33.2% | 18.2% |
| English | Grade 7 | 2022 | 27.9% | 22.9% | 31.8% | 17.5% |
| English | Grade 7 | 2023 | 30.0% | 22.6% | 30.5% | 16.9% |
| English | Grade 7 | 2024 | 30.8% | 22.0% | 29.9% | 17.3% |
| English | Grade 7 | 2025 | 28.6% | 21.8% | 30.7% | 18.9% |
| English | Grade 8 | 2019 | 25.7% | 24.9% | 32.4% | 17.0% |
| English | Grade 8 | 2022 | 28.0% | 25.4% | 30.8% | 15.8% |
| English | Grade 8 | 2023 | 29.6% | 24.7% | 29.8% | 15.9% |
| English | Grade 8 | 2024 | 29.7% | 24.3% | 30.0% | 16.0% |
| English | Grade 8 | 2025 | 28.3% | 23.9% | 30.2% | 17.6% |
| English | Grade 11 | 2019 | 21.4% | 21.4% | 30.2% | 27.1% |
| English | Grade 11 | 2022 | 23.6% | 21.6% | 29.2% | 25.6% |
| English | Grade 11 | 2023 | 23.4% | 21.2% | 29.4% | 26.0% |
| English | Grade 11 | 2024 | 23.4% | 20.9% | 29.5% | 26.2% |
| English | Grade 11 | 2025 | 22.5% | 20.5% | 29.6% | 27.4% |
| Math | All grades | 2019 | 34.9% | 25.4% | 20.0% | 19.7% |
| Math | All grades | 2022 | 42.0% | 24.7% | 17.3% | 16.1% |
| Math | All grades | 2023 | 41.3% | 24.1% | 17.5% | 17.1% |
| Math | All grades | 2024 | 40.5% | 23.9% | 17.6% | 17.9% |
| Math | All grades | 2025 | 39.0% | 23.7% | 17.9% | 19.4% |
| Math | Grade 3 | 2019 | 26.8% | 23.0% | 27.7% | 22.5% |
| Math | Grade 3 | 2022 | 34.4% | 22.1% | 24.4% | 19.1% |
| Math | Grade 3 | 2023 | 33.0% | 21.9% | 24.8% | 20.4% |
| Math | Grade 3 | 2024 | 32.5% | 21.9% | 24.9% | 20.8% |
| Math | Grade 3 | 2025 | 31.8% | 21.9% | 24.8% | 21.5% |
| Math | Grade 4 | 2019 | 24.8% | 30.3% | 24.9% | 20.0% |
| Math | Grade 4 | 2022 | 33.3% | 28.4% | 21.6% | 16.7% |
| Math | Grade 4 | 2023 | 31.1% | 28.1% | 22.1% | 18.7% |
| Math | Grade 4 | 2024 | 30.6% | 28.2% | 22.2% | 19.0% |
| Math | Grade 4 | 2025 | 29.5% | 28.2% | 22.4% | 19.9% |
| Math | Grade 5 | 2019 | 35.3% | 26.7% | 16.8% | 21.2% |
| Math | Grade 5 | 2022 | 42.9% | 25.5% | 14.6% | 16.9% |
| Math | Grade 5 | 2023 | 41.5% | 25.2% | 15.1% | 18.3% |
| Math | Grade 5 | 2024 | 40.4% | 24.6% | 15.3% | 19.8% |
| Math | Grade 5 | 2025 | 39.1% | 24.8% | 15.7% | 20.4% |
| Math | Grade 6 | 2019 | 34.2% | 27.3% | 18.6% | 19.9% |
| Math | Grade 6 | 2022 | 40.6% | 27.0% | 16.0% | 16.4% |
| Math | Grade 6 | 2023 | 41.0% | 25.8% | 15.8% | 17.4% |
| Math | Grade 6 | 2024 | 40.6% | 25.1% | 15.8% | 18.5% |
| Math | Grade 6 | 2025 | 38.9% | 24.5% | 16.1% | 20.4% |
| Math | Grade 7 | 2019 | 36.5% | 25.7% | 18.5% | 19.4% |
| Math | Grade 7 | 2022 | 42.4% | 25.6% | 16.5% | 15.6% |
| Math | Grade 7 | 2023 | 42.3% | 24.5% | 16.3% | 16.9% |
| Math | Grade 7 | 2024 | 41.5% | 24.6% | 16.8% | 17.1% |
| Math | Grade 7 | 2025 | 39.6% | 24.3% | 16.7% | 19.4% |
| Math | Grade 8 | 2019 | 40.8% | 22.6% | 15.8% | 20.8% |
| Math | Grade 8 | 2022 | 48.0% | 22.8% | 13.4% | 15.9% |
| Math | Grade 8 | 2023 | 48.3% | 21.7% | 13.3% | 16.6% |
| Math | Grade 8 | 2024 | 46.5% | 21.9% | 13.4% | 18.1% |
| Math | Grade 8 | 2025 | 44.5% | 21.6% | 13.9% | 20.0% |
| Math | Grade 11 | 2019 | 45.5% | 22.3% | 18.4% | 13.8% |
| Math | Grade 11 | 2022 | 51.8% | 21.3% | 15.1% | 11.8% |
| Math | Grade 11 | 2023 | 51.4% | 21.3% | 15.3% | 12.0% |
| Math | Grade 11 | 2024 | 51.0% | 21.1% | 15.6% | 12.3% |
| Math | Grade 11 | 2025 | 48.6% | 20.9% | 16.3% | 14.2% |
Switch grade and subject and the same shape holds in all fourteen grade-and-subject combinations, and in both all-grade totals: more children at Minimal than in 2019, fewer at Proficient, and Advanced close to where it started. There is no line through 2020 and 2021 because there is nothing honest to draw — 2020 statewide testing was cancelled, and in 2021 the state allowed districts to give a local assessment instead, so far fewer students sat the same test that the surrounding years compare.
None of that is about your child. It is the water they are swimming in, and knowing the water is not the same as knowing the swimmer.
We're moving SchoolScope's charts and profiles to the current names so a school's history reads in one consistent vocabulary. Until that ships, you'll see the source-year term — a 2024–25 result still shows as Exceeded or Met on the site today. Either way, the reporting year and original term stay in the data notes. Renaming the levels did not move any school's percentages. Our earlier article on the exceeded-versus-met split uses the source-year terms for exactly that reason.
What is different in grade 11?
Grade 11 English and math results also include an Early Assessment Program status for the California State University system. Students can authorize the release of their English and math results to CSU, and they must authorize each subject separately. According to the California Department of Education's EAP guide, releasing those results has no effect on admission.
CSU uses the result after admission as one of several measures of readiness and placement for first-year English and math courses.
Here is what each level does at CSU. CDE spells it out by subject: Advanced means enrolling straight into the standard first-year CSU course in that subject. Proficient means the same, as long as the student passes an approved year-long grade 12 course in that subject with a C- or better — so the senior-year schedule matters. Developing and Minimal lead to a supported version of that college-level course. It carries credit, with extra help built in. Another measure can qualify the student instead: SAT, ACT, high school coursework, GPA, or college transfer coursework. Some California community colleges accept the same result for placement; not all do.
Read the EAP status as early planning information, not a college-admission score or a verdict on whether a student is ready for college.
Is a school-level CAASPP result the same thing?
No. Your child's Student Score Report is private and describes one child. Public CAASPP results combine tested students. The public files group results by state, district, or school, then by grade, subject, and reported student groups. California suppresses results for groups that are too small to report safely.
SchoolScope builds its school pages from those public group files. CDE does not put children's names or individual score reports in them, so we don't have your child's. On a school page, we show the grade rows CDE publishes for that school. A missing grade or dash can mean the school doesn't serve it, no result was published, or the group was too small to report. A real zero prints as a zero. Our methodology explains the data sources and limits.
A school where 60% of students are Proficient or Advanced tells you how that tested group performed. It does not tell you where your child will land or explain why the percentage is high or low.
School-level test results can help you compare patterns across subjects and years — but each year's number is a mostly different set of kids. Only the students who repeat a grade sit the same grade's test twice. So a school's fifth-grade percentage going up doesn't mean any individual child grew.
For your own child, the report's score history is a run of scores across grades — not the matched-student growth measure described above, which compares a child against others who started where they did. A school or teacher may have measures of their own. Schools get a separate one: California publishes a growth model for schools, districts, and student groups. It follows the same students from one grade to the next, in grades 4 through 8. We show it on profiles where the state publishes it.
We leave it out of the Scope Score on purpose. It tracks family income about three times as closely as our own growth measure does, and in elementary school it covers grades 4 and 5 only. We lay out that reasoning here.
Test results still cannot show how a teacher responds when a child gets stuck, whether the classroom feels warm, or whether your kid will want to walk through the door each morning. Explore California public-school results, then use the numbers to form questions for the school. If a lower percentage is what sent you here, our guide to what a low school score can and cannot mean adds context. If a high Advanced rate is what sent you here instead, Does "Advanced" Predict College? We Checked 1,732 Schools looks at what that share does and doesn't forecast.
Does "Proficient" mean the same thing on every test?
No. Keep the test and state attached to the label. California reports Advanced, Proficient, Developing, and Minimal. Texas STAAR reports Masters Grade Level, Meets Grade Level, Approaches Grade Level, and Did Not Meet Grade Level, with Approaches or higher counted as passing. Those categories belong to different tests with different standards and cut scores. A California Developing result doesn't translate to Texas Approaches Grade Level just because both sit third in a four-level list.
NAEP, the federal sample test, uses Proficient differently too: its Proficient level does not mean meeting grade-level expectations.
For this report, name the test and the subject: "Proficient on California's grade 5 Smarter Balanced math test." CAASPP is the umbrella, not the test. Naming the actual one keeps a single result from becoming a label for the child. Keep that habit for any score, from any state or any test.
Help us make SchoolScope more useful
Optional. Up to 280 characters.
Anonymous. Your answer stays with us — we don’t publish it.
Thanks — that helps.
Keep reading
The new labels answer what your child's score is called. These answer what it actually means.
- The split that mattersWhy 80% "Met or Exceeded" Can Mean Two Different SchoolsTwo schools can both post 80% met-or-exceeded and be nothing alike — one because most kids exceeded, the other because most just cleared the bar.Read
- If the number is badYour School Scored Low. Here's What to Do About It.A low score isn't a verdict on your kid or your school — here's how to read it and what's actually worth asking about.Read
- The stakes of the top labelDoes "Advanced" Predict College? We Checked 1,732 SchoolsWhat the new top label — Advanced — is actually correlated with, and what it isn't.Read
- Beyond one testWhat School Rankings Get Wrong — And What We Can (and Can't) FixWhy a single CAASPP score, read alone, tells you less than parents assume.Read
Sources
7 sources · 3 government · 1 research · 2 organizations · 1 SchoolScope
Claims in this post were checked against their original sources on Aug 20, 2026.
Government data
Research
Organizations
SchoolScope analysis
Scope Scores are SchoolScope’s analysis of public data, not official ratings. They are one way of reading the numbers and shouldn’t be the only thing a school decision rests on. Scores quoted in the text are a snapshot from August 20, 2026 and move when the data or the method does; any live table on this page is drawn fresh from the same source. A live table rounds district averages to whole numbers — a figure like 83.5 in the text and 84 in a table below it is the same score, rounded differently, not a disagreement.
Published Aug 13, 2026 · Updated Aug 20, 2026 · Analysis by Bri Stanback, SchoolScope · Report a data issue
Cite this guide
Stanback, Bri. “2026 CAASPP Scores: Ranges, Levels, and When Results Arrive.” SchoolScope, August 20, 2026. https://schoolscope.co/blog/understanding-caaspp-scores-parent-guide